Critical Value Calculator
Welcome to the critical value calculator! Here you can quickly determine the critical value(s) for two-tailed tests, as well as for one-tailed tests. It works for most common distributions in statistical testing: the standard normal distribution N(0,1) (that is when you have a Z-score), t-Student, chi-square, and F-distribution.
What is a critical value? And what is the critical value formula? Scroll down – we provide you with the critical value definition and explain how to calculate critical values in order to use them to construct rejection regions (also known as critical regions).
What is a critical value?
In hypothesis testing, critical values are one of the two approaches which allow you to decide whether to retain or reject the null hypothesis. The other approach is to calculate the p-value (for example, using the p-value calculator).
The critical value approach consists of checking if the value of the test statistic generated by your sample belongs to the so-called rejection region, or critical region, which is the region where the test statistic is highly improbable to lie. A critical value is a cut-off value (or two cut-off values in the case of a two-tailed test) that constitutes the boundary of the rejection region(s). In other words, critical values divide the scale of your test statistic into the rejection region and the non-rejection region.
Once you have found the rejection region, check if the value of the test statistic generated by your sample belongs to it:
- If so, it means that you can reject the null hypothesis and accept the alternative hypothesis; and
- If not, then there is not enough evidence to reject H0.
But how to calculate critical values? First of all, you need to set a significance level, , which quantifies the probability of rejecting the null hypothesis when it is actually correct. The choice of α is arbitrary; in practice, we most often use a value of 0.05 or 0.01. Critical values also depend on the alternative hypothesis you choose for your test, elucidated in the next section.
Critical value definition
To determine critical values, you need to know the distribution of your test statistic under the assumption that the null hypothesis holds. Critical values are then the points on the distribution which have the same probability as your test statistic, equal to the significance level . These values are assumed to be at least as extreme at those critical values.
The alternative hypothesis determines what "at least as extreme" means. In particular, if the test is one-sided, then there will be just one critical value; if it is two-sided, then there will be two of them: one to the left and the other to the right of the median value of the distribution.
Critical values can be conveniently depicted as the points with the property that the area under the density curve of the test statistic from those points to the tails is equal to :
-
Left-tailed test: the area under the density curve from the critical value to the left is equal to ;
-
Right-tailed test: the area under the density curve from the critical value to the right is equal to ; and
-
Two-tailed test: the area under the density curve from the left critical value to the left is equal to , and the area under the curve from the right critical value to the right is equal to as well; thus, total area equals .

As you can see, finding the critical values for a two-tailed test with significance boils down to finding both one-tailed critical values with a significance level of .
How to calculate critical values?
The formulae for the critical values involve the quantile function, , which is the inverse of the cumulative distribution function () for the test statistic distribution (calculated under the assumption that H0 holds!): .
Once we have agreed upon the value of , the critical value formulae are the following:
- Left-tailed test:
- Right-tailed test:
- Two-tailed test:
In the case of a distribution symmetric about 0, the critical values for the two-tailed test are symmetric as well:
Unfortunately, the probability distributions that are the most widespread in hypothesis testing have somewhat complicated formulae. To find critical values by hand, you would need to use specialized software or statistical tables. In these cases, the best option is, of course, our critical value calculator! 😁
How to use this critical value calculator?
Now that you have found our critical value calculator, you no longer need to worry how to find critical value for all those complicated distributions! Here are the steps you need to follow:
-
Tell us the distribution of your test statistic under the null hypothesis: is it a standard normal N(0,1), t-Student, chi-squared, or Snedecor's F? If you are not sure, check the sections below devoted to those distributions, and try to localize the test you need to perform.
-
Choose the alternative hypothesis: two-tailed, right-tailed, or left-tailed.
-
If needed, specify the degrees of freedom of the test statistic's distribution. If you are not sure, check the description of the test you are performing. You can learn more about the meaning of this quantity in statistics from the degrees of freedom calculator.
-
Set the significance level, . We pre-set it to the most common value, 0.05, by default, but you can, of course, adjust it to your needs.
-
The critical value calculator will then display not only your critical value(s) but also the rejection region(s).
Go to the advanced mode of the critical value calculator if you need to increase the precision with which the critical values are computed.
Z critical values
Use the Z (standard normal) option if your test statistic follows (at least approximately) the standard normal distribution N(0,1).

In the formulae below, denotes the quantile function of the standard normal distribution N(0,1):
-
Left-tailed Z critical value:
-
Right-tailed Z critical value:
-
Two-tailed Z critical value:
Check out Z-test calculator to learn more about the most common Z-test used on the population mean. There are also Z-tests for the difference between two population means, in particular, one between two proportions.
t critical values
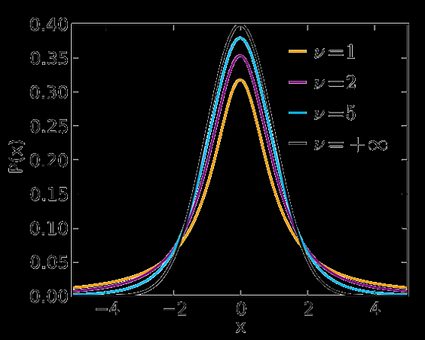
Use the t-Student option if your test statistic follows the t-Student distribution. This distribution is similar to N(0,1), but its tails are fatter – the exact shape depends on the number of degrees of freedom. If this number is large (>30), which generically happens for large samples, then the t-Student distribution is practically indistinguishable from N(0,1). Check our t-statistic calculator to compute the related test statistic.
In the formulae below, is the quantile function of the t-Student distribution with degrees of freedom:
-
Left-tailed t critical value:
-
Right-tailed t critical value:
-
Two-tailed t critical values:
Visit the t-test calculator to learn more about various t-tests: the one for a population mean with an unknown population standard deviation, those for the difference between the means of two populations (with either equal or unequal population standard deviations), as well as about the t-test for paired samples.
chi-square critical values (χ²)
Use the χ² (chi-square) option when performing a test in which the test statistic follows the χ²-distribution.
You need to determine the number of degrees of freedom of the χ²-distribution of your test statistic – below, we list them for the most commonly used χ²-tests.

Here we give the formulae for chi square critical values; is the quantile function of the χ²-distribution with degrees of freedom:
-
Left-tailed χ² critical value:
-
Right-tailed χ² critical value:
-
Two-tailed χ² critical values: and
Several different tests lead to a χ²-score:
-
Goodness-of-fit test: does the empirical distribution agree with the expected distribution?
This test is right-tailed. Its test statistic follows the χ²-distribution with degrees of freedom, where is the number of classes into which the sample is divided.
-
Independence test: is there a statistically significant relationship between two variables?
This test is also right-tailed, and its test statistic is computed from the contingency table. There are degrees of freedom, where is the number of rows, and is the number of columns in the contingency table.
-
Test for the variance of normally distributed data: does this variance have some pre-determined value?
This test can be one- or two-tailed! Its test statistic has the χ²-distribution with degrees of freedom, where is the sample size.
F critical values
Finally, choose F (Fisher-Snedecor) if your test statistic follows the F-distribution. This distribution has a pair of degrees of freedom.
Let us see how those degrees of freedom arise. Assume that you have two independent random variables, and , that follow χ²-distributions with and degrees of freedom, respectively. If you now consider the ratio , it turns out it follows the F-distribution with degrees of freedom. That's the reason why we call and the numerator and denominator degrees of freedom, respectively.

In the formulae below, stands for the quantile function of the F-distribution with degrees of freedom:
-
Left-tailed F critical value:
-
Right-tailed F critical value:
-
Two-tailed F critical values: and
Here we list the most important tests that produce F-scores: each of them is right-tailed.
-
ANOVA: tests the equality of means in three or more groups that come from normally distributed populations with equal variances. There are degrees of freedom, where is the number of groups, and is the total sample size (across every group).
-
Overall significance in regression analysis. The test statistic has degrees of freedom, where is the sample size, and is the number of variables (including the intercept).
-
Compare two nested regression models. The test statistic follows the F-distribution with degrees of freedom, where and are the number of variables in the smaller and bigger models, respectively, and is the sample size.
-
The equality of variances in two normally distributed populations. There are degrees of freedom, where and are the respective sample sizes.
FAQ
What is a Z critical value?
A Z critical value is the value that defines the critical region in hypothesis testing when the test statistic follows the standard normal distribution. If the value of the test statistic falls into the critical region, you should reject the null hypothesis and accept the alternative hypothesis.
How do I calculate Z critical value?
To find a Z critical value for a given confidence level α:
-
Check if you perform a one- or two-tailed test.
-
For a one-tailed test:
-
Left-tailed: critical value is the
α-th quantile of the standard normal distribution N(0,1). -
Right-tailed: critical value is the
(1-α)-th quantile.
-
-
Two-tailed test: critical value equals
±(1-α/2)-th quantile of N(0,1). -
No quantile tables? Use CDF tables! (The quantile function is the inverse of the CDF.)
-
Verify your answer with an online critical value calculator.
Is a t critical value the same as Z critical value?
In theory, no. In practice, very often, yes. The t-Student distribution is similar to the standard normal distribution, but it is not the same. However, if the number of degrees of freedom (which is, roughly speaking, the size of your sample) is large enough (>30), then the two distributions are practically indistinguishable, and so the t critical value has practically the same value as the Z critical value.
What is the Z critical value for 95% confidence?
The Z critical value for a 95% confidence interval is:
- 1.96 for a two-tailed test;
- 1.64 for a right-tailed test; and
- -1.64 for a left-tailed test.