GDP per Capita Calculator
The GDP per capita calculator is a tool to compute the Gross Domestic Product per unit of population in a given country. If you read further, you can learn how to calculate GDP per capita and get familiar with the real GDP per capita definition. Besides, you can gain some insight into why this indicator is vital in macroeconomics and get some data on the GDP per capita of different countries.
To read more, visit our [real GDP calculator]. (calc:5081)
What is GDP per capita?
The Gross Domestic Product (GDP) covered in our GDP calculator is one of the most prominent indicators in macroeconomics. It is devised with the purpose of measuring a country's total economic output, that is, the amount of goods and services produced domestically.
Since the inflation rate might bias the nominal (unadjusted) GDP for different years, economists typically work with real (inflation-adjusted) GDP values. Still, the real GDP is not the most reliable indicator to measure the standard of living or make a comparison between countries. As GDP is equal to the total income of a country, its average fraction for each person in the country's population gives a better proxy for the standard of living. To read more about inflation, see our inflation calculator.
The simple formula of GDP per capita is the following:
GDP per capita = Gross Domestic Product / Population
To see the difference between these indicators, let's have a look at the below table with real GDP and GDP per capita data from different countries between 2007 and 2017. By contrasting these years, we can have some insight into not only how economies changed throughout a decade, but we can also see how countries dealt with the global financial crisis of 2007-2008 and its aftermath.
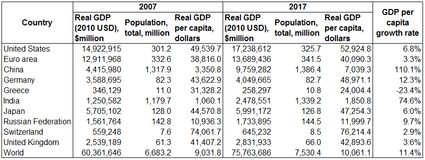
In both years, the United States had the highest real GDP; however, the US GDP per capita is still lower than in Switzerland. It means that even though the US economy produced the highest value, Swiss people enjoyed a much higher standard of living. Among the listed countries, China's GDP per capita doubled, thanks to its high GDP growth rate; however, its standard of living is still far from that of developed nations like the United States. In contrast, Greece, the Eurozone state which was hit hardest by the 2008 crisis, saw its standard of living drop over the last ten years. Another interesting point is that despite its incredible growth, India's GDP per capita is still far lower than the world's average.
The US GDP per capita vs. the highest GDP per capita in the world
If you are curious about which countries people are the wealthiest, the ranking below gives you a practical guideline. The table represents the 20 countries with the highest GDP per capita (purchasing power parity, international dollars) based on a projection by the International Monetary Fund (IMF) outlook for the year 2019. According to the list, the US GDP per capita takes only the 12th position. Qatar has the highest level of average standard of living, where people, in general, are twice wealthier compared to an average person in the United States.
Rank | Country | GDP per capita (PPP, Int$) |
|---|---|---|
1 | Qatar | 133,254.39 |
2 | Macao SAR | 126,584.20 |
3 | Luxembourg | 112,622.85 |
4 | Singapore | 102,026.74 |
5 | Brunei Darussalam | 86,479.57 |
6 | Ireland | 81,686.24 |
7 | Norway | 76,620.59 |
8 | United Arab Emirates | 72,182.30 |
9 | Kuwait | 69,257.48 |
10 | Hong Kong SAR | 67,557.84 |
11 | Switzerland | 66,779.85 |
12 | United States | 65,061.59 |
13 | San Marino | 63,045.70 |
14 | Netherlands | 59,105.15 |
15 | Saudi Arabia | 57,357.63 |
16 | Iceland | 56,914.64 |
17 | Taiwan Province of China | 55,290.48 |
18 | Germany | 54,983.52 |
19 | Sweden | 54,474.30 |
20 | Austria | 54,083.77 |
GDP per capita and inequality
Another aspect is needed to get an exact picture of a society's material life. Albeit high GDP per capita means a high average income. If the economy is characterized by high inequality, the range of people living in impoverished circumstances is wider. Therefore, the number of people living in poverty, one of the most crucial issues in our society, depends on the level of the average GDP per capita and the degree of economic inequality. Accordingly, there are two direct ways to reduce poverty: by boosting the GDP per capita or reducing inequality by redistributing resources from the rich to the poor.