Sharpe Ratio Calculator
The Sharpe ratio calculator helps you find out the attractiveness of a risky investment. In other words, the Sharpe ratio of a risky investment is equal to the volatility of its net worth. The concept of the Sharp ratio calculation is firmly connected to the capital asset pricing model (CAPM) that helps you determine the expected return of your asset or investment according to its inherent risk level.
🙋 You should also check out our general investment calculator.
Conducting Sharpe ratio calculation
To understand the background of the Sharpe ratio formula, as the first step, we need to get some insights into the parameters it uses.
The Sharpe ratio formula is the following:
Sharpe ratio = Risk premium / σ
Risk premium = Ra - Rf
where:
Risk premiumis the additional return that an investor requires to hold a risky asset rather than one that is risk-free. The CAPM calulator provides more insight for measuring risk premiums together with some more explanation of risky and risk-free assets.Rais the return of asset or investment.Rfis the risk-free return.σor sigma stands for the standard deviation of a risky asset. A risky asset or investment means that it can have numerous possible outcomes. The usual measure of the spread of these possible outcomes is the standard deviation or variance. To see the statistical representation of the standard deviation, you may have a look at binomial distribution calculator.
To explain the variable sigma or standard deviation in a financial context, we aligned the following illustration that gives you more insight in a visual way. The three graphs display three different investments with possible returns.
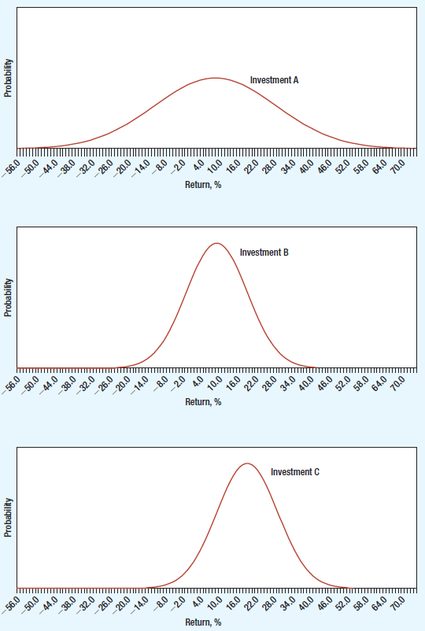
Investments A and B offer an expected return of 10%, but A has a much wider spread of possible outcomes. Its standard deviation is 15%; the standard deviation of B is 7.5%. Investors generally avoid uncertainty and would prefer B to A. Comparing B to C, the standard deviation is the same; however, the expected return is 20% from C and only 10% from B. Most investors prefer high expected returns and would, therefore, prefer C to B.
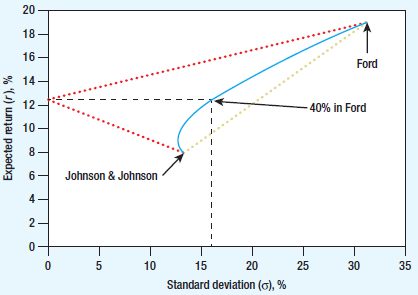
The following graph shows how the expected return and standard deviation change if you decide to set up a simple portfolio by holding a different combination of two stocks. The curved blue line represents the expected return and risk you could achieve by various combinations of the two stocks.
For example, if you invest 40% of your money in Ford and the remainder in Johnson & Johnson, your expected return is 12.3%, which is 40% of the way between the expected returns on the two stocks. The standard deviation is 15.9%, which is less than 40% of the way between the standard deviations of the two stocks. It is because diversification reduces risk.
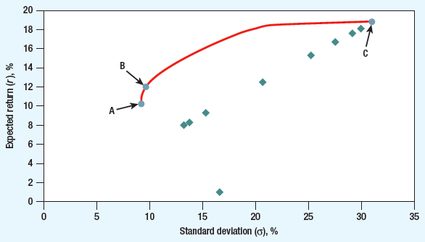
However, you are not limited to investing only in two stocks in the real world. Therefore the number of combinations is immense. In the graph below, the spots represent different stocks with their expected return and standard deviation. There are many possible combinations of expected return and standard deviation from investing in a mix of these stocks. Like a reasonable investor, you most probably prefer high expected returns and dislike high standard deviations, so you would prefer portfolios along the red line. These are the efficient portfolios.
Taking into account the possibility of lending and borrowing further extends the range of investment possibilities. In the following graph, the red line represents the scope of efficient portfolios.
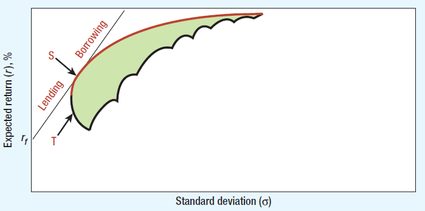
To find the most efficient one, you need to draw the steepest straight line from rf to the curved red line of efficient portfolios. That line will be tangent to the red curve. The efficient portfolio at the tangency point is the best choice as it gives you the highest expected return with the lowest standard deviation. However, also, it offers the highest ratio of risk premium to standard deviation. So you probably already know that the Sharpe ratio formula represents this ratio which is the tangency point on the red curve.